Graphing
Contents
Introduction
Line Plots
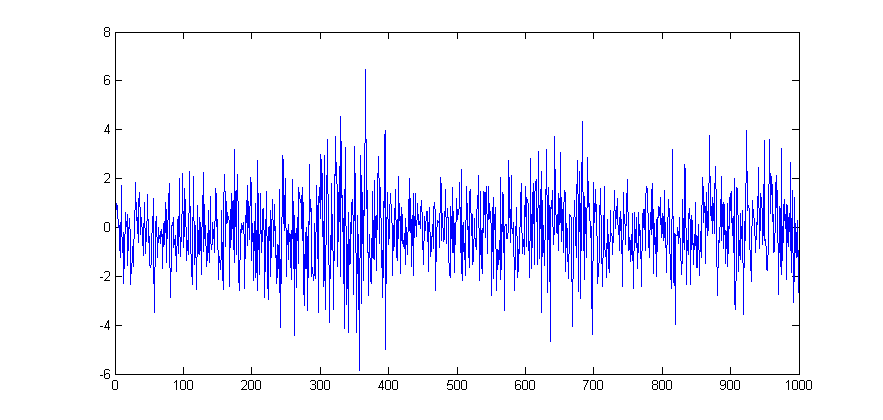
For this example we use one of Matlab's sample dataset to plot a simple line plot showing the time series movement of the stock market data. First Load the data.
load stockreturnsThe data contains a (100x10) matrix of stock market observations and we are going to plot all of these data point on a single line plot using the 'plot' function.
figure
plot(stocks(:))
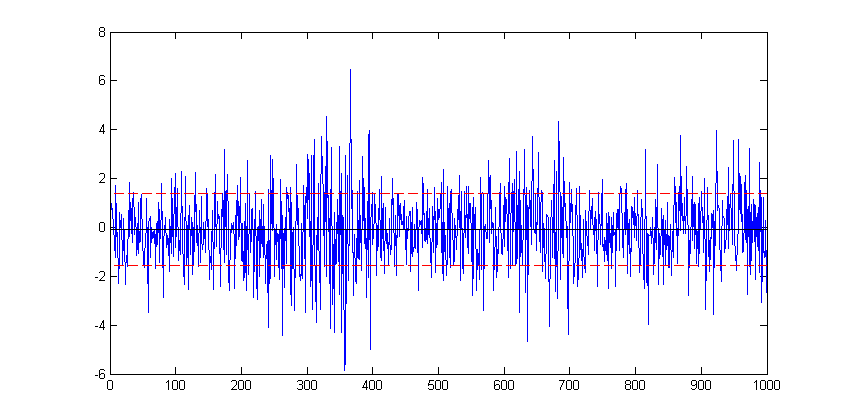
sd=std(stocks(:);
hold on
plot(xlim, [sd sd],'--r')
plot(xlim, [-sd -sd],'--r')
