File list
This special page shows all uploaded files.
| Date | Name | Thumbnail | Size | Description | Versions |
|---|---|---|---|---|---|
| 15:31, 20 March 2021 | US3monthRate.xlsx (file) | 13 KB | 1 | ||
| 23:23, 3 May 2018 | Mg forecast.png (file) | 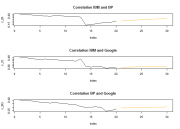 |
6 KB | 1 | |
| 23:22, 3 May 2018 | Correlation2.png (file) | 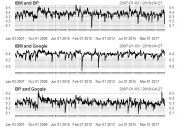 |
16 KB | 1 | |
| 23:21, 3 May 2018 | Correlation1.png (file) | 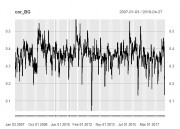 |
9 KB | 1 | |
| 23:19, 3 May 2018 | Ug forecast4.png (file) |  |
6 KB | 1 | |
| 23:18, 3 May 2018 | Ug forecast3.png (file) | 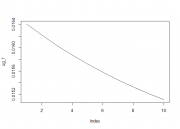 |
4 KB | 1 | |
| 23:17, 3 May 2018 | Unnamed-chunk-18-1.png (file) |  |
4 KB | 1 | |
| 23:16, 3 May 2018 | CondVar2.png (file) |  |
6 KB | 3 | |
| 23:06, 3 May 2018 | GoogleChart1.png (file) |  |
11 KB | 1 | |
| 00:15, 21 March 2018 | PosteriorProbs.png (file) |  |
9 KB | 1 | |
| 00:13, 21 March 2018 | Posteriors.png (file) | 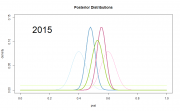 |
9 KB | 1 | |
| 00:04, 21 March 2018 | Priors.png (file) | 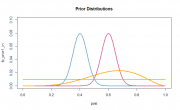 |
7 KB | 1 | |
| 23:59, 20 March 2018 | TempData.png (file) | 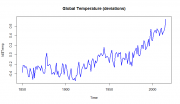 |
8 KB | 1 | |
| 00:10, 12 February 2017 | Global Temperature.csv (file) | 3 KB | 1 | ||
| 23:38, 14 September 2016 | IRF2.png (file) | 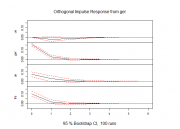 |
6 KB | 1 | |
| 23:37, 14 September 2016 | IRF1.png (file) |  |
6 KB | 1 | |
| 23:36, 14 September 2016 | Drates.png (file) |  |
10 KB | 1 | |
| 23:35, 14 September 2016 | Rates.png (file) |  |
7 KB | 1 | |
| 08:22, 26 July 2016 | FoodInfl.csv (file) | 5 KB | 1 | ||
| 08:22, 26 July 2016 | EnergInfl.csv (file) | 5 KB | 1 | ||
| 08:22, 26 July 2016 | CoreInfl.csv (file) | 5 KB | 1 | ||
| 08:21, 26 July 2016 | AggInfl.csv (file) | 5 KB | 1 | ||
| 17:01, 19 July 2016 | FinalResult.jpeg (file) |  |
209 KB | 1 | |
| 16:39, 19 July 2016 | ManipulatedPlot.jpeg (file) |  |
97 KB | 1 | |
| 16:28, 19 July 2016 | FirstPlot.jpeg (file) | 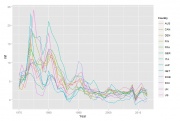 |
134 KB | 1 | |
| 16:47, 24 April 2016 | Multiple2.jpeg (file) | 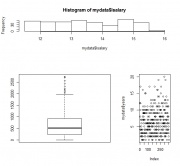 |
83 KB | 1 | |
| 16:47, 24 April 2016 | Multiple1.jpeg (file) | 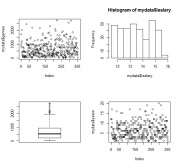 |
134 KB | 1 | |
| 08:58, 3 February 2016 | Sampling dist2.jpeg (file) | 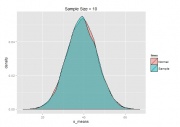 |
49 KB | 1 | |
| 08:57, 3 February 2016 | Sampling dist1.jpeg (file) | 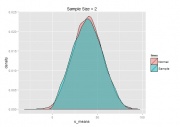 |
57 KB | 1 | |
| 08:56, 3 February 2016 | Sampling LLN.jpeg (file) | 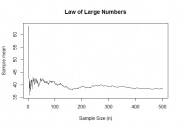 |
48 KB | 1 | |
| 23:25, 2 February 2016 | UKagedistribution.png (file) | 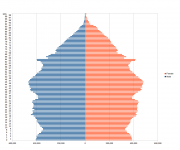 |
48 KB | 1 | |
| 22:55, 2 February 2016 | OLSasympdist kernel.jpeg (file) | 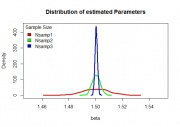 |
64 KB | 1 | |
| 22:41, 2 February 2016 | OLSunbiasedness hist.jpeg (file) |  |
50 KB | 1 | |
| 10:58, 4 November 2015 | InspectElement2.JPG (file) |  |
32 KB | 1 | |
| 10:58, 4 November 2015 | InspectElement.JPG (file) |  |
44 KB | 1 | |
| 14:18, 2 November 2015 | Europe map2.png (file) |  |
7 KB | 1 | |
| 14:17, 2 November 2015 | Europe map1.png (file) |  |
233 KB | 1 | |
| 14:14, 2 November 2015 | UoM map.png (file) |  |
73 KB | 1 | |
| 09:13, 31 July 2015 | Lorenz.png (file) | 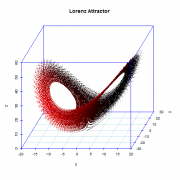 |
37 KB | 1 | |
| 09:13, 31 July 2015 | Mandelbrot.png (file) | 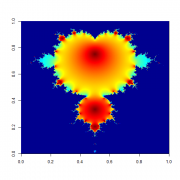 |
45 KB | 1 | |
| 20:19, 26 July 2015 | RGraphIntro8.png (file) | 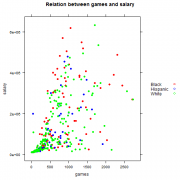 |
6 KB | 1 | |
| 20:19, 26 July 2015 | RGraphIntro7.png (file) | 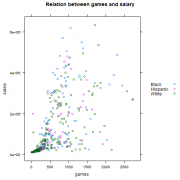 |
7 KB | 1 | |
| 20:18, 26 July 2015 | RGraphIntro6.png (file) | 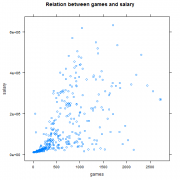 |
6 KB | 1 | |
| 20:16, 26 July 2015 | GraphIntro5.png (file) | 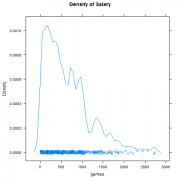 |
5 KB | 1 | |
| 20:15, 26 July 2015 | GraphIntro4.png (file) | 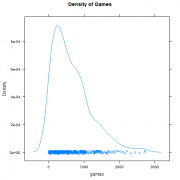 |
4 KB | 1 | |
| 20:14, 26 July 2015 | GraphIntro3.png (file) | 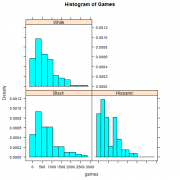 |
5 KB | 1 | |
| 20:11, 26 July 2015 | RGraphIntro3.png (file) | 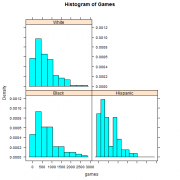 |
5 KB | 1 | |
| 20:04, 26 July 2015 | RGraphIntro2.png (file) | 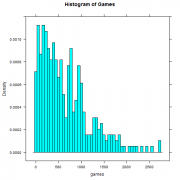 |
4 KB | 1 | |
| 20:01, 26 July 2015 | RGraphIntro1.png (file) | 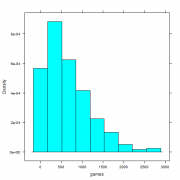 |
4 KB | 1 | |
| 10:09, 23 July 2015 | Mlb1.csv (file) | 75 KB | 1 |